

STAINLESS STEEL IN FIGURES: A GLOBAL AND SOUTH AFRICAN VIEW FOR 2025

Stainless steel has become an integral part of modern society, and a future without it is impossible to imagine. It is used in the provision of food, lean water, pharmaceuticals and medical care, chemical products, transport, and safety. It is therefore no surprise that stainless steel has maintained a strong growth curve since its inception just under 120 years ago.
The demand for stainless steel remains positive, resulting in an annual compound growth rate in the world’s melt shop production of 5.72%. The remarkable characteristic of the global growth of stainless steel is that it has remained between 5% and 6% annually, and has been constant since the late 1950s.
Most of this material is being produced in China. The Chinese share of world production has increased steadily from 12.9% in 2002 to 51.9% in 2015, with the current Chinese production share standing at 62.8%. The European Union’s share was 34.8% in 2002 but halved to around 17.3% in 2015. Currently, production in the EU accounts for approximately 10.1% of world production.
Stainless steel continues to outperform the rest of the major competitor metals, growing at a rate of more than 5% annually, which is more than double the growth of carbon steel, lead, and zinc individually.
There is also always higher demand for stainless steel than the tonnage used or consumed, however, the forecast for demand in the Americas remains flat for the future. Fortunately a slightly higher demand is expected for the Europe and Africa regions during 2025. The actual rate of projected consumption in these regions also appears stronger than that of the Americas for the next few years.
There is a strong similarity in the demand and expected consumption of Asia (excluding China) and the Americas.
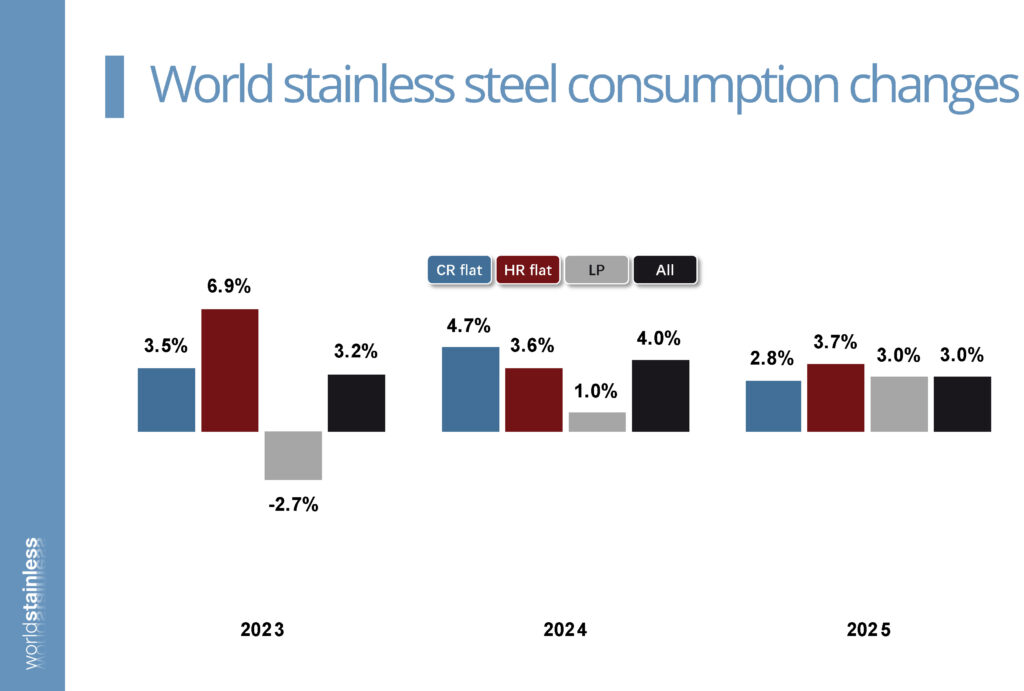
The expected rate of demand and consumption in China will be double that of other regions over the next two years. This alters the global forecast into a positive global outlook, but might be unattainable for regions outside China. The following graphics provide more detail on the forms of stainless steel being consumed at a global level. Global consumption figures highlight the decrease in hot-rolled flat products, with a forecast of lateral movement for 2025. Long products are making a good recovery from a slump in 2023. The overall consumption of all forms at a global level remains stable within the 3% to 4% range.
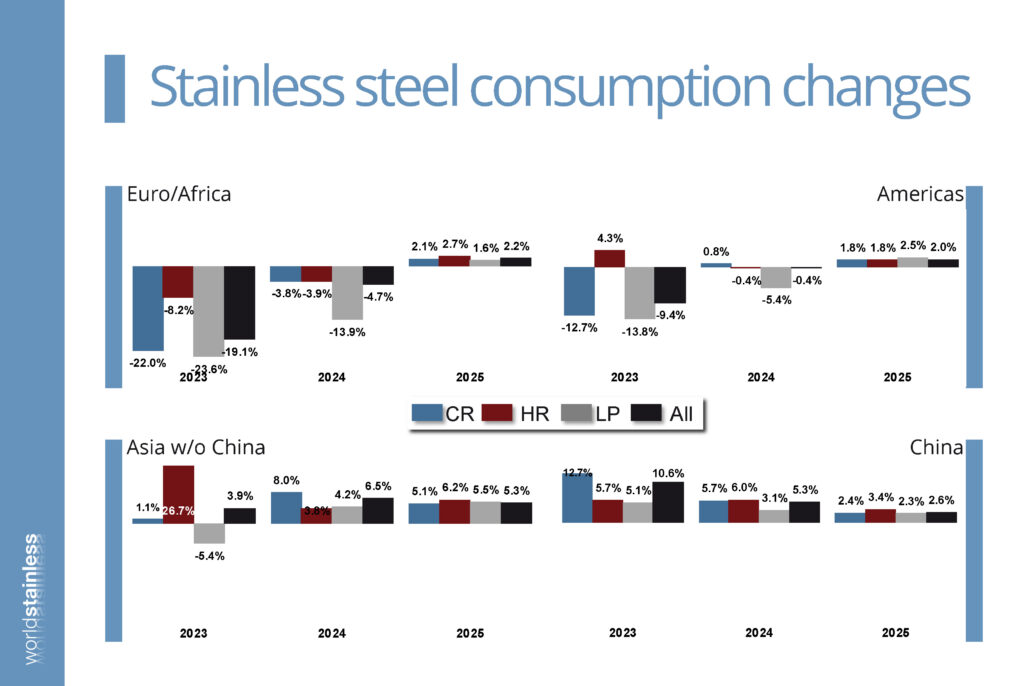
Across global regions, there was negative growth in all forms during 2023, except in China. During 2024, all regions except China saw an improvement in consumption across all forms. It is also forecasted that this trend will continue at a reduced rate into 2025.
The European and African regions can expect reasonable growth across all forms. While South Africa’s contribution to stainless steel consumption in the Euro/Africa region is marginal, it is hoped that this trend will be reflected locally. The statistics for the region up to 2024 correlate well with local statistics, giving Sassda good reason to believe that consumption growth will continue in 2025. This is underwritten by the fact that Sassda sources its data from various organisations, including the South African Iron and Steel Institute, the South African Revenue Service (SARS), and Columbus Stainless.
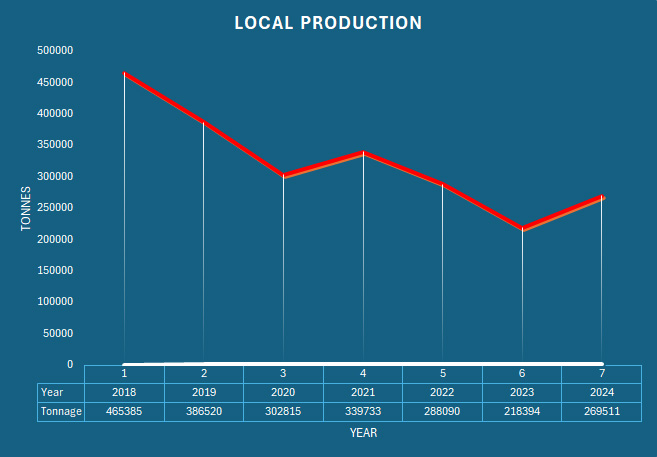
Local production is driven by exports to the European Union but remains severely restricted by the protective measures imposed by the EU on steel supply into the region. In 2022, local production was recorded at 288 090 tons, which declined to 218 394 tons in 2023. It is encouraging to report that local production ended 2024 on a positive note, yielding a total of 269 511 tons for the year. However, this still represents only about 30% of production capacity.
Local Production
In 2022, imports were recorded at 202 578 tons, declining to 147 886 tons in 2023. There was a substantial increase in imports during 2024, with a total of 176 025 tons. However, this figure still falls short of the 2022 level and remains significantly lower than the 353 093 tons imported in 2018.
Imports

The export tonnage for 2022 was recorded at 42 884 tons, declining to 37144 tons in 2023. The total export volume for 2024 was 44 124 tons, which is close to the 2018 figure of 44 102 tons.
Exports

The 2018 figure represents a very low baseline for the graph, reflecting the state of the industry after the so-called “nine wasted years” on the political front, which impacted the economy. This downward trend continued into 2019, with the effects of the pandemic and electricity supply shortages evident in the figures up to 2023. The upward swing in 2021 can be attributed to the industry restocking after COVID-19. The subsequent growth in 2022 was welcomed, as it was triple that of South Africa’s GDP growth. However, the industry was disappointed to see yet another decline of 16% in 2023. In 2024, the tables finally turned, with strong growth to 137 610 tons, exceeding the 2019 figure of 131 870 tons. There is good reason to believe that this growth will continue, albeit at a potentially lower rate.
Apparent Consumption
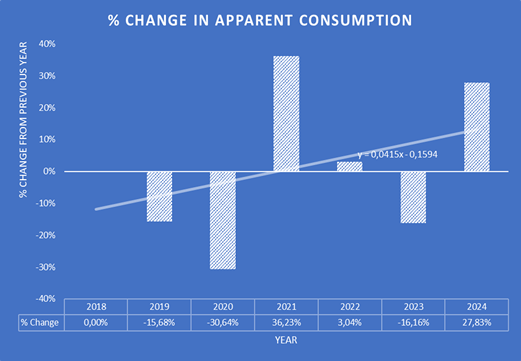
It is interesting to note that although local production is declining due to exports, the local consumption of stainless steel materials has shown a good recovery. The higher local demand, especially during the latter part of 2024, was met by increased imports. Sassda is excited about the prospect of increased local consumption, as the association’s mandate is to promote and grow local stainless steel conversion. While the full picture for 2024 is showing an increase of nearly 28%, Sassda is confident that 2025 will also be a year of positive growth after the 16% decline in local consumption from 2022 to 2023. It is expected that growth in local consumption will significantly outpace national GDP growth for South Africa in 2025 as it did during 2024.